If you haven't installed it yet, download and install Enthought Canopy. It's a big download, and you won't need it until the end of the lab exercises. At the end of installation, leave the checkbox checked that asks if you want Canopy to be your default Python environment:
Throughout this lab, you'll need the contents of this zip file. Unzip it into the same folder that you're going to be coding in.
Unfortunately, since we're working with files and graphics, you'll no longer be able to use the visualizer (but it'll be back next week). Instead, I recommend that you paste the lines directly into the Canopy interpreter. Since we're working with files, you'll need to make sure the contents of the zip file are in Canopy's current working directory. The easiest way to do this is:
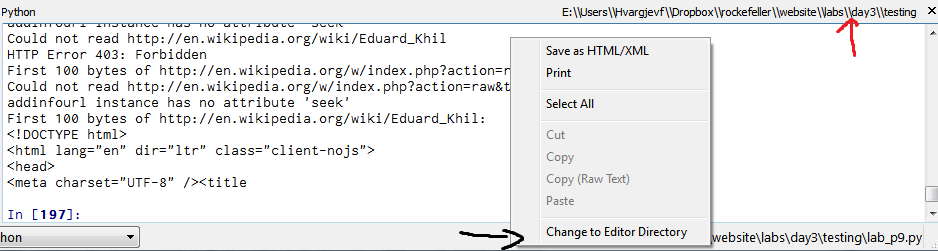
You can also change your current working directory by clicking on the displayed current working directory (marked with a red arrow in the image below):
For those of you not using Canopy, you can ask your about its current working directory using the command import os; print(os.getcwd()). You can also set the current working directory by using import os; os.chdir(path), where path is the directory you want, e.g. os.chdir("C:\\windows\\"). Note that Windows paths must have DOUBLE backslashes for technical reasons having to do with strings that we'll discuss next week.
this
is a plain text file
it contains this text
spread out
over five lines
What is the output of the following program? If the program crashes on the first line, then your current working directory isn't set up correctly. Flag me down and I'll help out.
f = open("plaintext.txt", "rb")
print(f)
print("Tell #0: " + str(f.tell()))

line_one = f.readline()
print(line_one)
print("Tell #1: " + str(f.tell()))

line_two = f.readline()
print(line_two)
print("Tell #2: " + str(f.tell()))

f.seek(-9, 1)
print("Tell #3: " + str(f.tell()))
print(f.readline())

next_three_bytes = f.read(3)
print(next_three_bytes)
print("Tell #4: " + str(f.tell()))

rest_of_the_file = f.read(5)
print(rest_of_the_file)
print("Tell #5: " + str(f.tell()))

f.seek(8)
print("Tell #6: " + str(f.tell()))

for line in f:
    print line
    print("Tell: " + str(f.tell()))

f.close()
input_file = open("plaintext.txt", "r")
output_file = open("output.txt", "w")
all_lines = input_file.readlines()
print(all_lines)
all_lines.reverse()
output_file.writelines(all_lines)
input_file.close()
output_file.close()
One very important thing when programming is to avoid reinventing the wheel. In this exercise, we'll explore various ways of writing lists to a file.
some_list = [6, 3, 10, 5, 16, 8, 4, 2, 1]
another_list = [101, 102, 103, 104]
output_file = open("some_lists.txt", "w")

output_file.write(str(len(some_list)))

for x in some_list:
    output_file.write(str(x))

output_file.write(str(len(another_list)))

for x in another_list:
    output_file.write(str(x))

output_file.close()
Why would it be hard to recover the original lists from the output file? Run this program and look at the generated output for some clues.
some_list = [6, 3, 10, 5, 16, 8, 4, 2, 1]
another_list = [101, 102, 103, 104]
output_file = open("some_lists.txt", "w")

output_file.write(str(len(some_list)) + "\n")

for x in some_list:
    output_file.write(str(x) + "\n")

output_file.write(str(len(another_list)) + "\n")

for x in another_list:
    output_file.write(str(x) + "\n")

output_file.close()
Is it possible to recover the two original lists using this file?
import pickle

some_list = [6, 3, 10, 5, 16, 8, 4, 2, 1]
another_list = [101, 102, 103, 104]
output_file = open("pickled_lists.txt", "w")

pickle.dump(some_list, output_file)
pickle.dump(another_list, output_file)

output_file.close()
Run the code above and open pickled_lists.txt.
import pickle

input_file = open("pickled_lists.txt", "r")

some_list = pickle.load(input_file)
another_list = pickle.load(input_file)

print(some_list)
print(another_list)

input_file.close()
Compare this program to the one that you wrote for part 3. Much better!
import pickle

numbers = []
for i in range(10000):
    numbers.append(i)

output_file = open("pickled_numbers.txt", "wb")
pickle.dump(numbers, output_file, protocol=0)
output_file.close()

output_file = open("pickled_numbers_binary.txt", "wb")
pickle.dump(numbers, output_file, protocol=2)
output_file.close()
Run the code above and compare the size of the two files generated. Open pickled_numbers_binary.txt and observe that the encoding used is opaque to your human eyes.
You might ask "Why would I ever want to pickle something?" The answer is that often times your programs will generate complex objects (for example, lists of lists), and generating these complex objects may take a very long time. By being able to save them to a file, your program can pick up where it left off last time.
The file RBS_library.csv (in the .zip file you downloaded) was generated using Excel. Open it up using Excel, or if you don't have Excel, you can open a Google docs version at this link.
import csv
f = open('RBS_library.csv', 'rb')
csv_reader = csv.reader(f, delimiter = ',')

print(csv_reader.line_num)
dummy = csv_reader.next()
print(csv_reader.line_num)
headers = csv_reader.next()
print(csv_reader.line_num)

plasmid_id = []
GFP_off = []

for row in csv_reader:
    plasmid_id.append(row[0])
    GFP_off.append(float(row[3]))

print(plasmid_id)
print(GFP_off)
Run the code above (ensure that the current working directory is the same as the csv file) and make sure you understand the results of the print statements.
Python provides a built in module called urllib2 which allows you to treat URLs somewhat like readable files. You can use read(), readline(), and readlines() just as with files.
import urllib2

urls = ['http://trololololololololololo.com', 'http://en.wikipedia.org/wiki/Eduard_Khil', 'http://en.wikipedia.org/w/index.php?action=raw&title=Eduard_Khil']

for url in urls:
    try:
        u = urllib2.urlopen(url)
        print "First 100 bytes of " + url + ":"
        print(u.read(100))
    except:
        print "Could not read " + url
opener = urllib2.build_opener()
opener.addheaders = [('User-agent', 'Mozilla/5.0')]

try:
    u = opener.open(urls[1])
    print "First 100 bytes of " + urls[1] + ":"
    print(u.read(100))
except:
    print "Could not read " + urls[1]
In this version of the code, Python masquerades as an old version of Firefox, and Wikipedia gleefully gives us the data we request.
import numpy as np

list_of_numbers = []
for i in range(100, 200):
    list_of_numbers.append(i)

array_of_numbers = np.arange(0, 99)

print(list_of_numbers)
print(array_of_numbers)
print(list_of_numbers ** 2)
print(array_of_numbers ** 2)
import numpy
import math

x = numpy.arange(1, 10)
y = math.log(x)
from numpy import *

t = arange(0, 2*pi, 0.01)
y = cos(t)
from numpy import *
from math import *

t = arange(0, 2*pi, 0.01)
y = cos(t)
Word of warning: Python will behave a bit differently depending on whether or not you're running commands from the interpreter window or from a file. If you're in doubt, always put .show() at the end of your code, and close all figures before running your code.
Throughout this section, you may find it helpful to consult the official PyPlot tutorial.
This is an optional exercise to demonstrate more precisely how draw and show work. It's perhaps more confusing than it's worth, but in the event that you're curious.
figure(1)
plot([1, 2, 3, 4], [1, 4, 9, 16])
xlabel('x axis')
clf()
figure(1)Try to run the program. What error do you get?
import matplotlib.pyplot as plt
plt.figure(1)
Try to run the program. What happens? How is this different from what you observed when directly typing in the same code using the interpreter?
import matplotlib.pyplot as plt
plt.figure(1)
plt.show()
What happens when you run the code now?
import matplotlib.pyplot as plt
plt.figure(1)
plt.plot([1, 2, 3, 4], [1, 4, 9, 16])
plt.show()
plt.xlabel('x axis')
As you see, nothing happens -- this is because Python does not update already existing figures unless you use a special command (called draw, see below).
If you want to alter a figure that already exists (i.e. is already showing) at the time that a program begins, you should use the plt.draw() command to tell matplotlib to update the drawing. Close the figure, and create a new figure by simply typing figure(1) in the Canopy interpreter.
import matplotlib.pyplot as plt
plt.figure(1)
plt.plot([1, 2, 3, 4], [1, 4, 9, 16])
plt.draw()
plt.xlabel('x axis')
What do you observe? The x-axis label does NOT appear! This is because the draw command came before the xlabel command. Unlike the initial show command that creates the figure, order is very important.
This minor inconsistency in the behavior of show() and draw() may seem a little confusing. Luckily, you don't really need to understand it, but I wanted to point it out in case you run into this behavior on your own later.